The Funnel Performance Metrics That Matter Most
Modern marketing funnels generate enormous amounts of data. The challenge is not finding numbers — it’s knowing which metrics actually matter.
Many businesses drown in dashboards while still struggling with inconsistent lead flow, poor conversions, rising acquisition costs, and stalled revenue growth. The reality is simple: not every metric deserves equal attention.
The most effective organizations focus on the funnel performance metrics that directly influence growth, profitability, and scalability.
In this guide, we’ll break down the key funnel metrics every business should monitor, why they matter, and how to use them to improve marketing and sales performance.
What Is Funnel Performance?
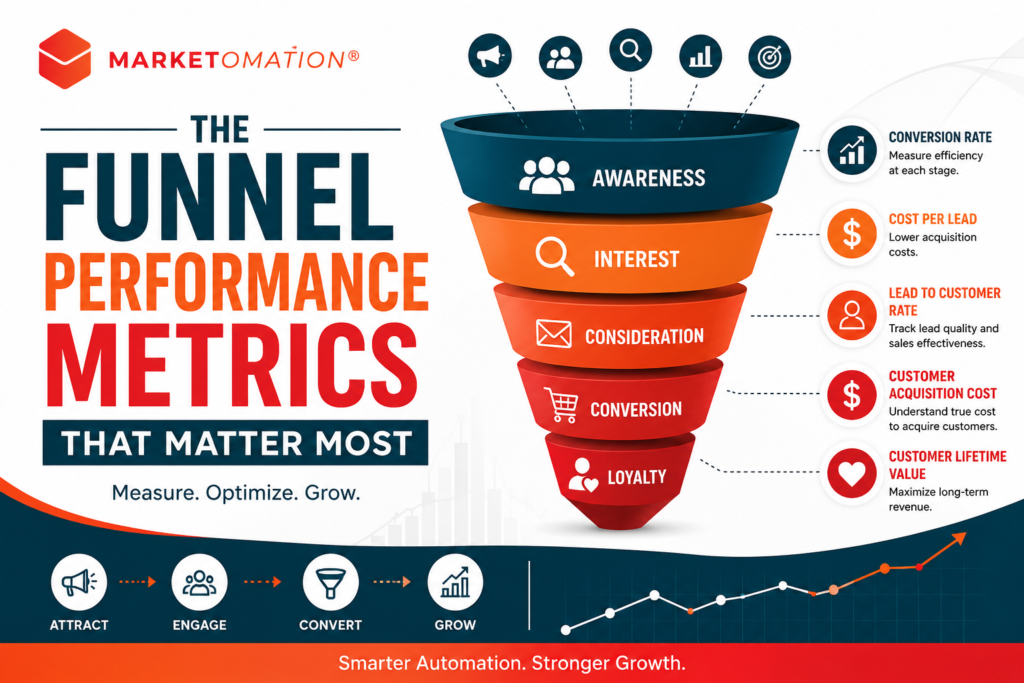
Funnel performance measures how effectively prospects move through your customer journey — from awareness to conversion and beyond.
A high-performing funnel does three things well:
- Attracts qualified traffic
- Converts leads efficiently
- Maximizes customer value over time
Strong funnel performance creates predictable growth. Weak funnel performance creates wasted ad spend, sales inefficiencies, and revenue leakage.
The key is identifying where your funnel is thriving and where prospects are dropping off.
Why Funnel Metrics Matter
Without clear metrics, businesses often rely on assumptions instead of data-driven decisions.
Tracking the right funnel KPIs helps you:
- Identify conversion bottlenecks
- Improve lead quality
- Lower customer acquisition costs
- Increase marketing ROI
- Improve sales alignment
- Forecast revenue more accurately
- Scale with confidence
The best-performing companies continuously optimize their funnel based on measurable outcomes — not guesswork.
The Funnel Performance Metrics That Matter Most
1. Traffic-to-Lead Conversion Rate
This metric measures how effectively your website or landing pages convert visitors into leads.
Formula
Traffic-to-Lead Conversion Rate=Website VisitorsLeads Generated×100
Traffic-to-Lead Conversion Rate=Website VisitorsLeads Generated×100
Why It Matters
If traffic is high but leads are low, your messaging, offers, UX, or targeting may be misaligned.
Optimization Tips
- Improve landing page clarity
- Strengthen calls-to-action (CTAs)
- Reduce form friction
- Align content with buyer intent
- A/B test headlines and layouts
2. Cost Per Lead (CPL)
Cost Per Lead reveals how much you spend to generate each new lead.
Formula
CPL=Number of LeadsMarketing Spend
CPL=Number of LeadsMarketing Spend
Why It Matters
A low CPL may seem positive, but inexpensive leads are meaningless if they don’t convert into customers.
The goal is profitable lead generation — not cheap lead generation.
Optimization Tips
- Refine audience targeting
- Improve ad relevance
- Focus on high-intent channels
- Eliminate underperforming campaigns
3. Lead-to-Customer Conversion Rate
This metric measures how many leads ultimately become paying customers.
Formula
Lead-to-Customer Conversion Rate=LeadsCustomers×100
Lead-to-Customer Conversion Rate=LeadsCustomers×100
Why It Matters
This is one of the clearest indicators of lead quality and sales effectiveness.
If your lead volume is high but customer conversions are low, the issue may be:
- Poor targeting
- Weak nurturing
- Sales process inefficiencies
- Misaligned messaging
Optimization Tips
- Improve lead qualification
- Implement automated nurture sequences
- Strengthen sales enablement
- Align marketing and sales teams
4. Customer Acquisition Cost (CAC)
CAC measures the total cost required to acquire a new customer.
Formula
CAC=New Customers AcquiredTotal Sales and Marketing Costs
CAC=New Customers AcquiredTotal Sales and Marketing Costs
Why It Matters
CAC directly impacts profitability and scalability.
If acquisition costs continue rising while revenue stays flat, your funnel efficiency is deteriorating.
Optimization Tips
- Improve conversion rates across the funnel
- Shorten sales cycles
- Increase referral business
- Invest in retention and upsells
5. Customer Lifetime Value (CLV)
Customer Lifetime Value estimates the total revenue a customer generates throughout their relationship with your business.
Formula
CLV=Average Purchase Value×Purchase Frequency×Customer Lifespan
CLV=Average Purchase Value×Purchase Frequency×Customer Lifespan
Why It Matters
CLV helps determine how much you can afford to spend on acquisition while remaining profitable.
Businesses with strong retention and recurring revenue typically outperform competitors over time.
Optimization Tips
- Improve onboarding experiences
- Build loyalty programs
- Increase upsell opportunities
- Deliver ongoing customer value
6. Funnel Drop-Off Rate
This metric identifies where prospects abandon the funnel.
Common Drop-Off Points
- Landing pages
- Forms
- Scheduling pages
- Checkout flows
- Email nurture sequences
Why It Matters
Even small conversion improvements at critical funnel stages can dramatically increase revenue.
Optimization Tips
- Simplify user experiences
- Reduce unnecessary steps
- Improve mobile optimization
- Strengthen trust signals
- Use behavioral analytics tools
7. Sales Cycle Length
Sales cycle length measures how long it takes for a lead to become a customer.
Why It Matters
Long sales cycles increase acquisition costs and reduce operational efficiency.
Optimization Tips
- Automate follow-ups
- Improve qualification processes
- Provide clearer offers
- Deliver better educational content earlier in the funnel
8. Marketing Qualified Leads (MQLs) vs. Sales Qualified Leads (SQLs)
Tracking MQLs and SQLs reveals whether marketing is attracting prospects that sales teams actually want.
Why It Matters
A disconnect between marketing and sales often leads to:
- Poor conversion rates
- Frustrated sales teams
- Wasted ad spend
- Inflated lead metrics
Optimization Tips
- Define qualification criteria collaboratively
- Use lead scoring
- Align messaging across departments
- Track conversion rates between stages
Vanity Metrics vs. Performance Metrics
One of the biggest mistakes businesses make is focusing on vanity metrics instead of meaningful business outcomes.
Vanity Metrics
- Social media likes
- Impressions
- Page views
- Email opens alone
Performance Metrics
- Revenue attribution
- Conversion rates
- CAC
- CLV
- Pipeline velocity
- Sales conversions
Vanity metrics may look impressive, but performance metrics drive growth.
How Marketing Automation Improves Funnel Performance
Marketing automation enables businesses to monitor, optimize, and scale funnel performance more effectively.
With automation, businesses can:
- Track user behavior in real time
- Trigger personalized nurture campaigns
- Score and segment leads automatically
- Improve attribution accuracy
- Reduce manual follow-up delays
- Optimize campaigns faster
At MarketOmation, we help businesses build automated systems that turn fragmented marketing data into actionable growth insights.
The Most Important Funnel Metric of All
While every KPI matters, the most important metric is ultimately:
Revenue Efficiency
This means understanding:
- How efficiently you acquire customers
- How profitably you retain them
- How predictably your funnel generates revenue
The healthiest funnels balance:
- Lead quality
- Conversion efficiency
- Customer retention
- Long-term profitability
Final Thoughts
The businesses that scale successfully are not the ones with the most data — they’re the ones that focus on the right data.
By tracking the funnel performance metrics that matter most, organizations can:
- Improve marketing ROI
- Strengthen sales performance
- Increase conversion rates
- Lower acquisition costs
- Create predictable, scalable growth
A high-performing funnel is never static. It requires continuous measurement, testing, refinement, and optimization.
When businesses combine the right metrics with intelligent automation, sustainable growth becomes far more achievable.
Ready to Improve Your Funnel Performance?
MarketOmation helps businesses optimize marketing funnels, automate lead nurturing, and improve conversion performance through intelligent marketing systems and AI-driven automation.
Visit MarketOmation.com to learn how we can help you build a smarter, more scalable growth engine.